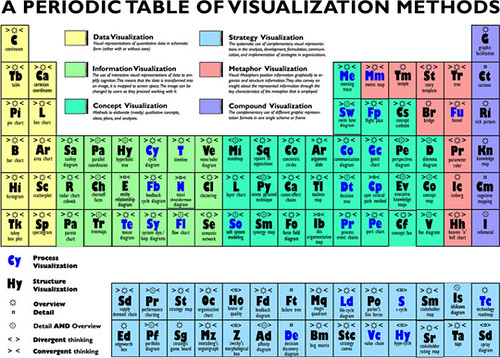
This in from the Visual Literacy Program – a European online program sponsored by four universities … to help engineering, software, science students, etc. better understand and use the various visual methods available to help express and communicate their ideas and creations. They have created a “Periodic Table of Visualization Methods” that pulls together all the various graphic modalities into one central place.
It is AWESOME! And, Graphic Facilitation is included (see ‘G’ in top right) — nice to see the ivory tower giving this practical and effective methodology its due (its not just pretty pictures as I keep telling the skeptics!).
Be sure to check out the web link, at the end of this blog post. They have set the image up so you can ‘mouseover’ the different elements – and view an example of each. Very handy and informative (although I disagree a little with some of their categorizations … but hey, its all in how you choose to cut the cards … you know what I mean).

See: http://www.visual-literacy.org/pages/documents.htm There are also interesting maps on the geographical locations of the different scholars and experts in the different methodologies and on the different visualization studies going on in different parts of the world. A great resource for all those grad studies who email me about the literature and statistics available. It might not all be on graphic recording and graphic facilitation but its a start.
Christina Merkley, The SHIFT-IT Graphic Coach


